Ap Bio Data Analysis Galapagos Finches
Evolution in Action: Data Analysis Galapagos Finches
1. Describe the major environmental change on Daphne Major that took place in 1977.
In 1977, Daphne Major was hit by a drought and there was virtually no rainfall for 18 months straight. This drought killed a lot of the island’s vegetation, resulting in many of the food sources that the finches relied on becoming very limited. Finches had to eat seeds, and as small seeds became scarce, they had to switch to eating large and hard seeds.
2. What types of medium ground finches were more likely to survive the environmental change you described?
The medium ground finches that had larger beaks were more likely to survive the environmental change (drought) . Due to the drought, the finches had to rely on seeds as their main food source. As the smaller seeds became scarce, the ground finches had to turn to the large, spiky, and hard seeds for food. The finches with larger beaks were able to crack open these seeds, while the finches with smaller beaks were unable to. As a result, 80% of the medium ground finches with small beaks died, while the larger beaked finches survived. Overall, the finches with small beaks were not able to overcome the new changes in the environment.
3. Observe the shapes of the graphs. It may help to draw a line connecting the tops of the black bars.
a. Describe the overall shape of each graph.
The overall shape of the graph is staggered. In general, it is higher in the middle of the data and lower on the sides of the data.
b. What do the shapes of the graphs indicate about the distribution of beak depths in these two groups of birds?
The shapes of the graph indicate that there is a variety of different beak depths, and they are close to the mean value. On average beak depths of the survivors was higher than the average beak depths of the non-survivors. As a result, the survivors had a larger population of larger beaks than the non-survivors.
4. Compare and contrast the distributions of beak depths for the survivors and nonsurvivors. For each distribution, include the range of the data and the most common measurements.
The distribution and shape of the beak depths for the survivors and non-survivors are pretty similar. The non-survivors’ beak depths ranged from 7.5mm to 11.25mm, with the most common beak depths being 8.5mm and 9.25mm. On the other hand, the survivors’ beak depths ranged from 8mm to 11.25mm, with the most common beak depth being 10mm. The average beak depth for non-survivors was 9.11mm and for survivors it was 9.67mm. This data displays how the survivors had a longer beak depth on average.
5. Propose a biological hypothesis to explain the differences in the distribution of beak depths for the survivors and nonsurvivors. (Hint: It may help to review your answers for Part 1.)
When there is change in food source for the birds during the drought, natural selection will increase chances for individuals with the most suitable trait (in this case, larger beaks) to survive. When the food source went from soft seeds to large hard seeds, the bird with larger beak depths had a higher chance of survival because they could eat these seeds for survival when food was scarce during drought. These birds were better adapted to the drought environment’s main food source than the birds with smaller beaks were.
6. Take a look at the means and standard deviations of beak depth in each group.
a. How do these means and standard deviations compare between the groups?
The data for beak depths of non-survivors has a mean of 9.11mm and a standard deviation of 0.88. As for the beak depths of the survivors there is a mean of 9.67mm and a standard deviation of 0.84. The mean for the non-survivors is less than the mean for the survivors meaning that the more depth a beak has the higher the chance of survival is. The standard deviations for both groups was around the same and didn’t have much of an impact on the survival rate.
b. If the standard deviations of the two groups were very different, what would you conclude about the groups?
If the standard deviations of the two groups were very different, we can conclude that one group would be a lot less dispersed and have data closer/clustered to the mean, meaning that it is more reliable and has less variety. Standard deviation is a measure of how dispersed the data is relative to the mean, so having large differences in the two groups deviations would mean that the data is dispersed very differently, and as a result one group would be more reliable than the other.
7. For each sample, calculate the mean beak depth and standard deviation (s). Record your answers in Table 1.
Non-survivors 5-Finch Sample |
Non-survivors 15-Finch Sample |
Survivors 5-Finch Sample |
Survivors 15-Finch Sample |
| Mean | 8.784mm | Mean | 9.113mm | Mean | 9.78mm | Mean | 9.56mm |
|---|---|---|---|---|---|---|---|
| s | 1.153mm | s | 0.984mm | s | 1.06mm | s | 0.903mm |
8. Record the means and standard deviations for each sample of survivors and nonsurvivors (the 50-bird samples in Figure 3, then the 15-bird and 5-bird samples in Table 1) in Table 2.
| Mean | Standard Deviation |
| 50-bird Sample | 15-bird Sample | 5-bird Sample | 50-bird Sample | 15-bird Sample | 5-bird Sample | |
|---|---|---|---|---|---|---|
| Non-survivors | 9.11mm | 9.113mm | 8.784mm | 0.88mm | 0.98mm | 1.153mm |
| Survivors | 9.67mm | 9.56mm | 9.78mm | 0.84 | 0.903 | 1.06mm |
9. Compare the means and standard deviations for the samples in Table 2.
1) > Are the means in smaller samples different from the means in larger samples? Explain why you think that is.
Yes, the means of the smaller samples and larger samples differ because there is more data for the larger sample. This means that the average will be slightly different because of the difference in data values, but overall it should produce relatively similar results. Larger samples are more accurate than smaller samples for this reason, because they have more data to base the mean off of. Each sample depends on which birds were randomly selected. All of the samples were randomly taken from a population with a variety of beak depths.
2) > Are the standard deviations in smaller samples different from the standard deviations in larger samples? Explain why you think that is.
Yes, the standard deviations of smaller samples and larger samples differ because the samples have different mean values and the larger sample has more data values. Since the value of standard deviation is dependent on how the data values are dispersed from the mean, the two samples will have different standard deviations because they have different means and data values.
The standard deviations of both groups of birds decrease while the sample size increases.
10. Which results (from 5, 15, or 50 birds) do you think are closest to the means and standard deviations of the entire population of medium ground finches on the island? Explain your answer.
The results from the 50-bird sample would be the closest to the means and standard deviations of the entire population of medium ground finches on the island. This is because it has the most data. The widest/largest data range would result in the most accurate results that reflect the whole population’s data the best. Data from a larger sample is accurate to describe the patterns of the entire population’s adaptation to changes in their environment because there is more data to base it off of.
11. What is one advantage and one disadvantage of calculating the mean from a sample of a population rather than the entire population?
One disadvantage of calculating the mean from a sample of a population instead of the entire population is that there is less data to study, so there is less cost and time. If the population to study is larger, then there is more information to be collected for research. Studying the same population in a wide range of environments can expose how each species adapts to changes in their habitat. However, a disadvantage of studying the entire population is that it
Advantages of calculating the mean from a sample of a population is that it takes less time and work than calculating from the whole population. It’s not practical to take the mean of a whole population if the population is large. Using samples of a population also helps avoid repetition within the data. One disadvantage is that using a sample population might create bias within the data.
12. Construct two bar graphs, one comparing the means of wing length for the two groups and another comparing the means of body mass.
• You can draw the graphs by hand below, or you can make them on a computer using Data Explorer (under the “Visualize” tab at the top) or another program. Make sure to include all your graphs when submitting this handout.
• For each graph, make sure to include a title and labels for the axes (including units).
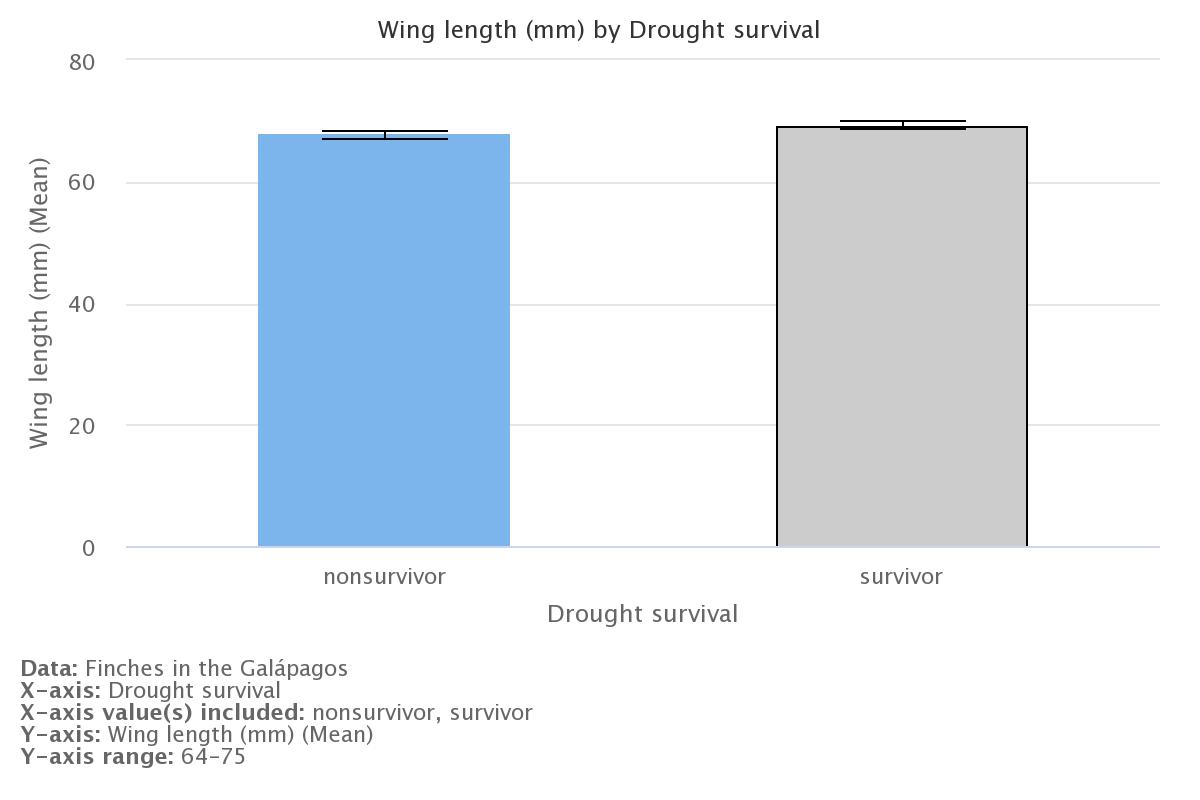
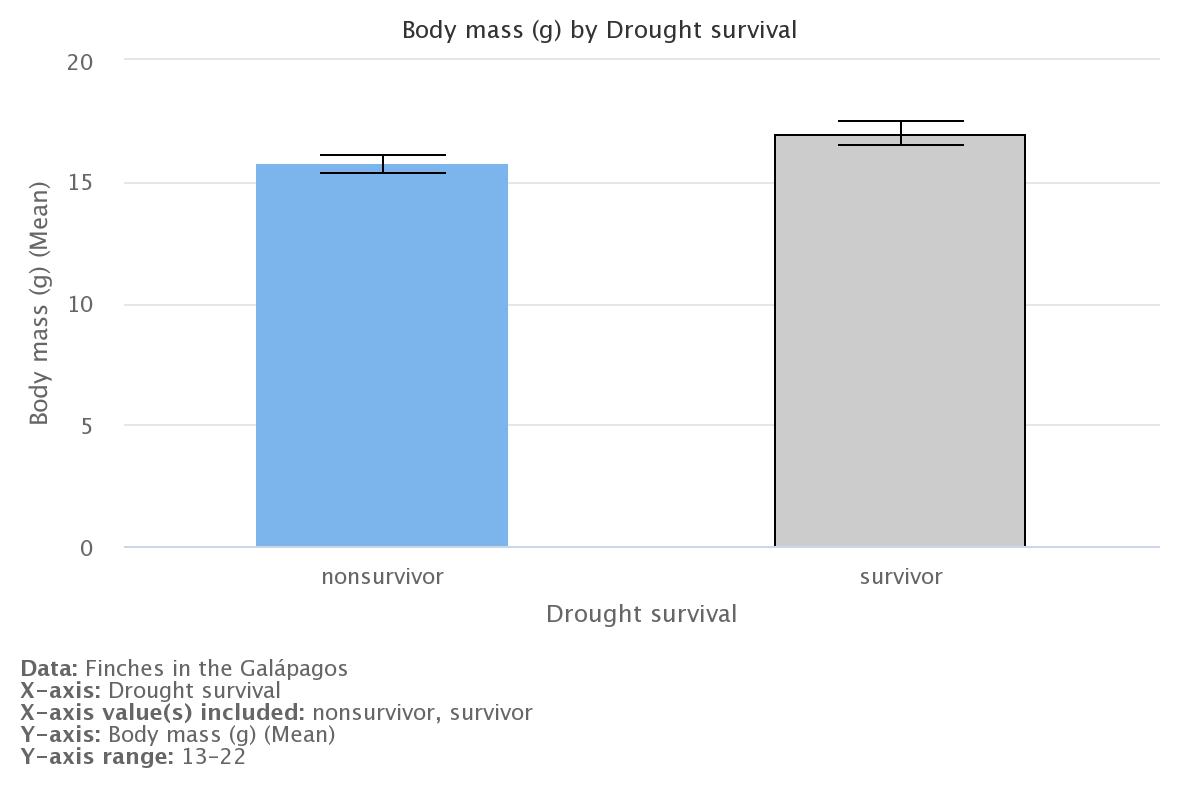
13. Based on your graphs, how does the mean wing length compare between survivors and nonsurvivors? What about the mean body mass?
Based on the graphs, the mean wing length of the survivors is longer than the mean wing length of the non-survivors. For body mass, the mean for the survivors is higher than that of the non-survivors.
14. What do your graphs suggest about the effects of the drought on birds with particular wing lengths and body masses?
The graphs suggest that during the drought, the survivors were finches with longer wings and larger body masses. The finches with small wings and small body mass were at a disadvantage and were less likely to survive. We can assume that since the survivors had larger beaks, they had large wings and large body masses.
15. The film in Part 1 claimed that beak depth is the trait that made the greatest difference in survival for the birds during the drought. Do the data you examined support this claim? Explain your answer.
The data shows that the average beak depth was larger for survivors compared to non survivors. This supports how larger beak depths increased the rate of survival for the birds. The data in the graphs shows how wing length and body mass was larger for non-survivors. This allows us to conclude that birds with bigger beaks also were larger overall. However, the graphs show that wing length and body mass were larger for survivors. Therefore, with the information we were given, the important trait for survival is not clear.
16. Based on what you learned from the film, why might beak depth play a more important role in survival during the drought than either wing length or body mass? (Hint: According to the film, what was the main impact of the drought on the finches?)
Beak depth plays a more important role in survivors compared to wing length or body mass because the Galapagos Finches had to adapt to the environmental change, leading to a change in food source. Ground finches with larger beaks had more of an advantage picking up larger seeds compared to finches with smaller beaks. This made it more likely for birds with bigger beaks to survive the drought and reproduce.Birds with longer wings were also more likely to have bigger beaks.Body mass was a factor affecting the birds during the drought because bigger birds also had bigger beaks.
17. How might variation in key traits within a population, such as beak depth in medium ground finches, make that population more likely to survive environmental changes?
Variation in key traits within a population makes that population more likely to survive environmental changes because it increases the chances that one of those traits will help individuals with it survive. This can be seen with the medium ground finches, who had variation with beak sizes. Due to the variation, some birds had larger beaks which helped those individuals survive when food became scarce during the drought.
Activity #2
1. Describe the major environmental change on Daphne Major that took place in 1977.
In Daphne Major, 1977 a drought resulted in a major environmental change. The finches had to switch from small seeds to larger and harder seeds. The birds had to adapt to these changes and in the end larger birds with bigger beaks survived.
2. Based on what you know so far, what differences (if any) do you think there were between the finches that
survived this major environmental change and the finches that did not?
The main difference between the survivors and the non-survivors was their size. The finches that survived had larger body mass, larger wings, and larger beaks. This means that in this environment change, it was necessary for the finches to have specific traits. The reason that the larger beaked finches were able to survive over the small beaked finches was their ability to feed from the large seeds.
3. Calculate the mean for each column in Table 1, and record your results (rounded to two decimal places) in the table.
4. Calculate the standard deviation for each column in Table 1, and record your results (rounded to two decimal places) in the table.
5.Calculate the standard error of the mean for each column in Table 1, and record your results (rounded to two decimal places) in the table.
6. Calculate the 95% CI for each column in Table 1, and record your results (rounded to two decimal places) in the table.
Non-survivors Survivors
| Descriptive statistics | Body mass (g) |
Wing Length(mm) | Tarsus length (mm) | beak depth (mm) | Body mass (g) | Wing length (mm) | Tarsus length (mm) | Beak depth (mm) |
|---|---|---|---|---|---|---|---|---|
| Mean | 15.71 | 67.79 | 19.04 | 9.11 | 16.99 | 69.30 | 19.35 | 9.67 |
| Variance (s^2) | ||||||||
| Standard deviation (s) | 1.36 | 2.28 | 0.84 | 0.88 | 1.76 | 2.33 | 0.86 | 0.84 |
| Standard error of the mean (SEM) | ||||||||
| 95% confidence interval (CI) |
7. Construct four bar graphs that compare the means of each physical characteristic (body mass, wing length, tarsus length, and beak depth) for survivors and nonsurvivors.
8. In some cases, whether or not your error bars overlap can suggest whether the difference between the means is statistically significant — that is, due to actual differences between nonsurvivors and survivors instead of just happening by chance.
-
You created error bars that represent 95% CIs. What does it suggest if these error bars do not overlap?
-
For which of the four physical characteristics did your error bars not overlap?
9. Summarize the differences between nonsurvivors and survivors that you observed from your graphs. Make sure to consider each of the four physical characteristics and the error bars from the previous question.